

What is the acceptance rate for a call for papers? Figures from our own submissions
The acceptance rate for a call for papers is 5 percent at most in the typical market, and up to 19 percent per conference in our submissions for clients. Per individual abstract, roughly one in fourteen of ours is accepted, about 7 percent. An abstract is the talk proposal you submit in a call for papers, the public invitation a professional conference uses to assemble its program. The figures come from a representative sample of our submissions for clients, 2024 to 2026, and from the abstracts in it on which a decision has been made. This article explains how the two rates differ and what moves them, and works out how many submissions you need.
The acceptance rate for a call for papers is 5 percent at most in the typical market, and up to 19 percent per conference in our submissions for clients. Per individual abstract, roughly one in fourteen of ours is accepted, about 7 percent. An abstract is the talk proposal you submit in a call for papers, the public invitation a professional conference uses to assemble its program. The figures come from a representative sample of our submissions for clients, 2024 to 2026, and from the abstracts in it on which a decision has been made. This article explains how the two rates differ and what moves them, and works out how many submissions you need.
What is the acceptance rate for a call for papers?
At the volume of submissions a plannable pipeline needs, 5 percent at most is typical in the market, and in our submissions for clients we reach up to 19 percent acceptances per conference. For professional conferences in the business world there is no overarching statistic on acceptance rates; individual organizers publish their own figures, but a market value is missing. What circulates online mostly comes from the peer review of academic journals, where different rules apply than at a conference looking for practitioners for its program. So we looked at our own data.
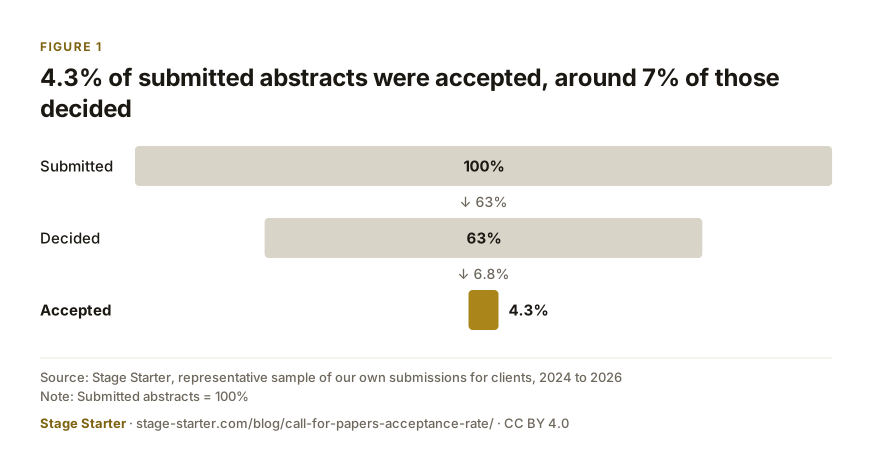
In a representative sample of our submissions for clients, 2024 to 2026, just under two thirds of the abstracts have been decided, meaning the conference has accepted or declined. Roughly one in fourteen of those was accepted, and all the others were declined. That gives an acceptance rate of around 7 percent per abstract. At conference level, roughly one in five decided conferences accepted at least one abstract.
Figure 1
4.3% of submitted abstracts were accepted, around 7% of those decided
Source: Stage Starter, representative sample of our own submissions for clients, 2024 to 2026
Note: Submitted abstracts = 100%
How does the rate at large tech conferences compare with small industry conferences?
At large tech conferences, the acceptance rate is in the single digits to low double digits, while in our experience it is higher at smaller industry conferences and on the direct email route. One organizer that publishes its figures is the Cloud Native Computing Foundation: for KubeCon + CloudNativeCon Europe 2025 in London it reported 2,947 submissions and an acceptance rate of 8 percent, and for the 2023 edition in Amsterdam 1,768 submissions and 11 percent.
Smaller industry conferences receive fewer submissions because their call addresses a narrower audience, and the organizers often decide themselves. In our experience a mid-sized conference easily receives 300 submissions, and a small industry conference considerably fewer. Each conference decides how many slots its program reserves for the open call, because keynotes, sponsor slots and invitations are filled without a call.
What counts as a decided abstract?
An abstract counts as decided as soon as the conference has accepted or declined it. Weeks often pass between submission and decision, so abstracts whose conference has not yet replied do not count as decided. A rate that also counted open cases as rejections would come out considerably lower, even though some of those abstracts will still be accepted. All figures come from a representative sample of our submissions for clients, 2024 to 2026.
Why the rate per conference is higher than per abstract
The two rates measure different things. Per abstract, every single talk proposal counts; per conference, an acceptance counts as soon as the conference has accepted at least one proposal. If an expert submits several abstracts to the same conference, for example for different tracks or formats, all of them count individually in the abstract rate, but only the hit counts in the conference rate.
An example makes the gap visible. If you submit three abstracts to a conference and one is accepted, the abstract rate shows one acceptance next to two rejections, while the conference counts as an acceptance. In our figures, roughly nine accepted abstracts come with every eight accepting conferences, so some conferences took more than one abstract.
You need both figures for planning. The rate per abstract tells you how many texts have to be written, and the rate per conference shows how many organizers you need to be in the running with to get an appearance. For winning clients, the appearance is what counts, which is why you plan your calendar with the conference rate.
How do I raise my acceptance rate?
Your acceptance rate rises with the fit between topic and conference, with a title that stands out in the pile, and with the volume of submissions. These are the factors on which a submission is won or lost, and if you work on them systematically, you lift your rate above the market value.
A program committee, the group of organizers and often volunteer experts that decides on the program, assesses each proposal against all the others in the same track. A good talk in the wrong track fails at a conference where it should never have landed. Most submissions fail on this fit or because they sound like a product pitch. The article What a program committee looks for describes what committees want.
The title decides whether an abstract gets attention, because the committee reads a great many proposals in a short time. It makes the topic and the benefit to the audience clear, and that rarely works in the first draft. Volume works through probability: because every conference decides in its own window and the rate per abstract stays in single digits, an appearance comes only from a larger number of submissions, and with few submissions a single acceptance or rejection shifts the whole rate.
Following up works where a conference without an open call fills its program through direct requests, and after a decision date has passed. During the review of an open call, a message changes nothing about the assessment, as the article Following up after a call for papers shows.
How many submissions does one appearance take?
At around 7 percent per abstract, one acceptance comes on average after fourteen abstracts, and five acceptances take around seventy. If you want to count on an acceptance, plan with considerably more, because with n submissions at a rate p, the chance of at least one acceptance is 1 − (1 − p)^n. After fourteen abstracts that is only around 64 percent, and the chance rises above 90 percent from 32 abstracts.
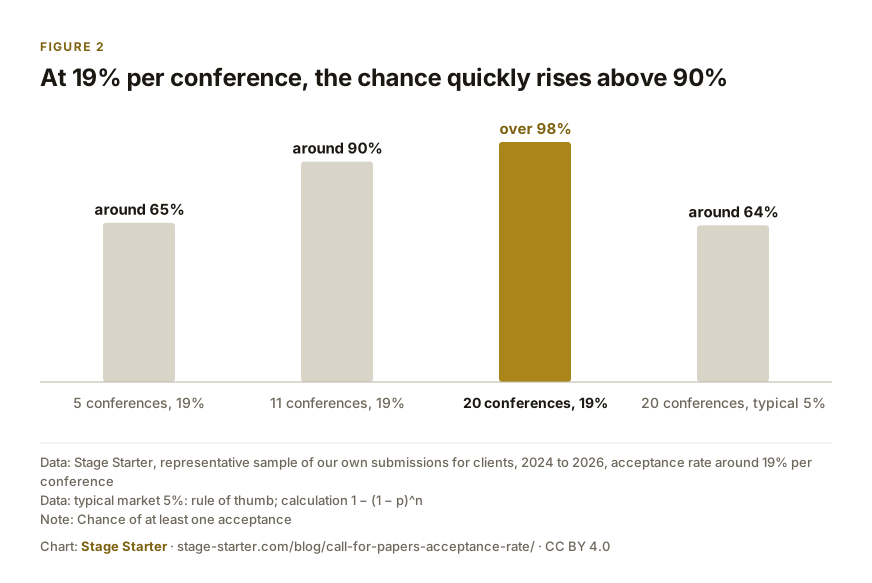
At conference level, the same formula gives a similar picture. At 19 percent per conference, five conferences give a chance of around 65 percent of at least one acceptance, eleven conferences around 90 percent and twenty more than 98 percent. At the typical 5 percent, the same chance with twenty conferences is only around 64 percent, and more than one in three such rounds ends without an acceptance.
Figure 2
At 19% per conference, the chance quickly rises above 90%
Source: Stage Starter, representative sample of our own submissions for clients, 2024 to 2026, acceptance rate around 19% per conference
Source: typical market 5%: rule of thumb; calculation 1 − (1 − p)^n
Note: Chance of at least one acceptance
Data and download
Style
Embed
Data as table
| Label | Value (%) |
|---|---|
| 5 conferences, 19% | around 65% |
| 11 conferences, 19% | around 90% |
| 20 conferences, 19% | over 98% |
| 20 conferences, typical 5% | around 64% |
Chart: Stage Starter, CC BY 4.0. Data: Stage Starter, representative sample of our own submissions for clients, 2024 to 2026, acceptance rate around 19% per conference; typical market 5%: rule of thumb; calculation 1 − (1 − p)^n; the source's terms apply.
Then there is time. Decisions come after the submission deadline, and in our analysis of 2,415 conferences that publicly invite talk proposals for 2026, the median gap between submission deadline and conference start is 50 days. Too small a volume of submissions therefore usually shows only when the calendar for the coming months is already empty. The call for papers guide shows how the whole process runs, from the call to the stage.
What this means alongside your day-to-day business
You run a consultancy, work as a freelancer or lead a company, and the stage is meant to bring you B2B clients. For a handful of appearances a year, these rates mean around seventy abstracts, spread across many conferences, each with its own form and deadline. Every abstract needs to fit its conference and carry a title that stands out, and on top come tracking deadlines and following up over months in which your day-to-day business also needs attention. The article Submitting yourself or hiring a speaker agency expresses this calculation in working days.
Stage Starter takes this work off your hands: we find the right calls, write the submission and submit in your name, follow up and accompany you all the way to the stage. The rates in this article come from that work for our clients. From you come your expertise and your approval of talk and abstracts. Working together starts from $999 net per month, and in the Speaker Audit from $549 net we clarify beforehand which conferences your topic suits. No agency can guarantee an acceptance, because the program committee decides.
Frequently asked questions
What is the acceptance rate for a call for papers?
At the volume of submissions a plannable pipeline needs, 5 percent at most is typical in the market. In our own submissions for clients, up to 19 percent of conferences say yes, and per individual abstract it is around 7 percent. Large tech conferences with thousands of submissions report rates of around 8 to 11 percent.
How many submissions does a conference receive for a call for papers?
Large tech conferences receive thousands of submissions, KubeCon + CloudNativeCon Europe 2025 for instance 2,947. In our experience a mid-sized conference easily receives 300, and small industry conferences considerably fewer. The narrower the audience, the smaller the field of applicants.
How many abstracts does a conference accept?
Each conference decides that itself, based on the number of slots its program reserves for the open call. In our figures, roughly one abstract in fourteen is accepted. Some conferences accept more than one abstract from the same person, since roughly nine accepted abstracts come with every eight accepting conferences.
How often do I have to submit before I get an acceptance?
At around 7 percent, one acceptance comes on average after fourteen abstracts, but the chance of at least one is then only around 64 percent. It exceeds 90 percent from 32 abstracts. At conference level, at 19 percent you need around eleven conferences to reach 90 percent.
Can I submit the same abstract to several conferences?
You may submit the same abstract to several conferences, and every submission pipeline works this way. It is adapted to the form and audience of each conference. If it is accepted more than once, you coordinate the dates with the organizers.
Why do most submissions fail?
Most submissions fail on their fit with the track or because they sound like a product pitch. A weak title loses the committee's attention before it reads the abstract. Volume plays a part too, because at a single-digit rate good proposals are declined as well.
What can I do after a rejection?
At these rates, a rejection is the most common outcome of a submission and says little about the talk. The same abstract then goes to the next suitable conference. The article Rejected as a speaker describes how to handle it.
Volume as a planning figure
If you know the rates, you plan your stage work in volumes and read a rejection as one of the expected outcomes on the way to the next acceptance. How many submissions your goals require, and who writes and tracks them, is something we clarify in an introductory call.

Marin Niehues is a management consultant and international speaker. With Niehues Consulting he works with organisations from scale-ups to DAX 40 corporations, and on stage he has spoken at more than 45 conferences in 23 countries.
All articles by Marin Niehues